Multi-Site Performance Monitoring [2026 Enterprise SRE Guide]: Global Observability, Distributed Synthetics & High-Cardinality Architecture
Comprehensive 2026 enterprise guide to multi-site performance monitoring: global synthetic probes, real user monitoring (RUM), OpenTelemetry collector tail-based sampling, and high-cardinality ClickHouse pipelines.
Multi-Site Performance Monitoring [2026 Enterprise SRE Guide]: Global Observability, Distributed Synthetics & High-Cardinality Architecture
Executive Summary & AEO Direct Answer: What is multi-site performance monitoring, and how do enterprise Site Reliability Engineering (SRE) teams implement it across distributed cloud regions and edge environments in 2026? The discipline of multi-site performance monitoring refers to the coordinated observability architecture, synthetic probing, real-user telemetry (RUM), and edge network tracking required to observe, measure, and optimize application health across globally dispersed data centers, multi-cloud regions, and edge points of presence (PoPs). Unlike traditional centralized application monitoring that captures metrics from a single origin server, enterprise multi-site performance monitoring correlates synthetic transactions from 25+ geographic checkpoints, instruments client-side Core Web Vitals (INP, LCP, CLS), ingests distributed traces via OpenTelemetry collectors with tail-based sampling, and analyzes high-cardinality time-series data inside columnar engines like ClickHouse to maintain sub-second Mean Time to Detect (MTTD) without incurring runaway ingestion costs.
In the contemporary SaaS and distributed enterprise landscape, uptime is no longer a binary status of whether your central database is online. Today's digital experiences rely on microservices, serverless edge workers, and distributed content delivery networks (CDNs) executing across dozens of cloud availability zones. A deployment that functions flawlessly in US-East (Northern Virginia) may suffer severe routing degradation, packet loss, or 1,200ms latency spikes for enterprise customers accessing services from Frankfurt, Singapore, or São Paulo.
For Principal Systems Architects, DevOps Directors, and Site Reliability Engineers (SREs), implementing robust multi-site performance monitoring has evolved into a foundational operational requirement. Modern web applications cannot afford localized outages or geographic blind spots that degrade conversion funnels and trigger Service Level Agreement (SLA) financial penalties.
Yet, orchestrating effective multi-site performance monitoring introduces formidable architectural challenges: mitigating high-cardinality data explosions across thousands of microservices and global PoPs, distinguishing between transient public internet transit noise and actual infrastructure faults, isolating noisy-neighbor tenants, and integrating heterogeneous telemetry streams into a unified, actionable single pane of glass.
In this comprehensive 3,000+ word technical guide, we dissect the end-to-end engineering blueprints for multi-site performance monitoring, compare leading synthetic and APM platforms, analyze high-cardinality time-series database design, provide production-ready Playwright and OpenTelemetry configurations, and present concrete architectural patterns to safeguard your global customer experience.
1. What Is Multi-Site Performance Monitoring? Core Observability Pillars
At its architectural core, multi-site performance monitoring unifies four discrete telemetry methodologies to provide continuous, high-fidelity visibility into geographically distributed software systems:
┌────────────────────────────────────────────────────────────────────────┐
│            MULTI-SITE PERFORMANCE MONITORING: 4 PILLARS                │
├────────────────────────────────────────────────────────────────────────┤
│ 1. Global Synthetic Probes (Active Monitoring)                         │
│ • Scripted headless browser journeys (Playwright / Chromium)          │
│ • Geographically distributed PoP checkpoints (25+ global nodes)       │
│ • Continuous multi-step checkout, login, and API assertions            │
├────────────────────────────────────────────────────────────────────────┤
│ 2. Real User Monitoring (Passive / In-Vivo Telemetry)                  │
│ • W3C Navigation & Resource Timing API instrumentation                 │
│ • Core Web Vitals (INP < 200ms, LCP < 2.5s, CLS < 0.1) by country/ASN   │
│ • ISP-specific routing latency and CDN edge cache hit ratios          │
├────────────────────────────────────────────────────────────────────────┤
│ 3. Distributed Edge & APM Tracing (Correlated Context)                 │
│ • W3C Trace Context propagation across edge proxies and microservices │
│ • OpenTelemetry Collector pipelines with tail-based trace sampling    │
│ • Ingestion gateways enforcing tenant-aware rate limiting             │
├────────────────────────────────────────────────────────────────────────┤
│ 4. Network & Anycast Infrastructure Telemetry                          │
│ • BGP routing path tracking, DNS resolution times, and TCP handshakes │
│ • ICMP jitter, packet loss, and TLS handshake latency across regions   │
│ • Service Level Objective (SLO) error budget burn-rate alerting       │
└────────────────────────────────────────────────────────────────────────┘- Global Synthetic Probes (Active Probing): Headless browser instances executing deterministic user flows (authentication, cart checkouts, file processing) from commercial cloud regions and residential ISP backbones to validate functional integrity before real users encounter regressions.
- Real User Monitoring (RUM - Passive Telemetry): In-browser instrumentation capturing real client-side experiences across distinct operating systems, browsers, mobile devices, and autonomous system numbers (ASNs).
- Distributed Tracing & APM: Distributed context propagation (
traceparentheaders) correlating edge API gateway hops with backend microservices, database queries, and message brokers. - Network & Routing Fabric Telemetry: Continuous measurement of DNS resolution time, TCP connection establishment, TLS handshakes, BGP route flapping, and Anycast routing stability across global transit providers.
By integrating these four pillars, modern multi-site performance monitoring bridges the gap between internal infrastructure health metrics and external customer-perceived digital experience.
2. Distributed Architecture: Edge Collectors, Gateways, and Tail Sampling
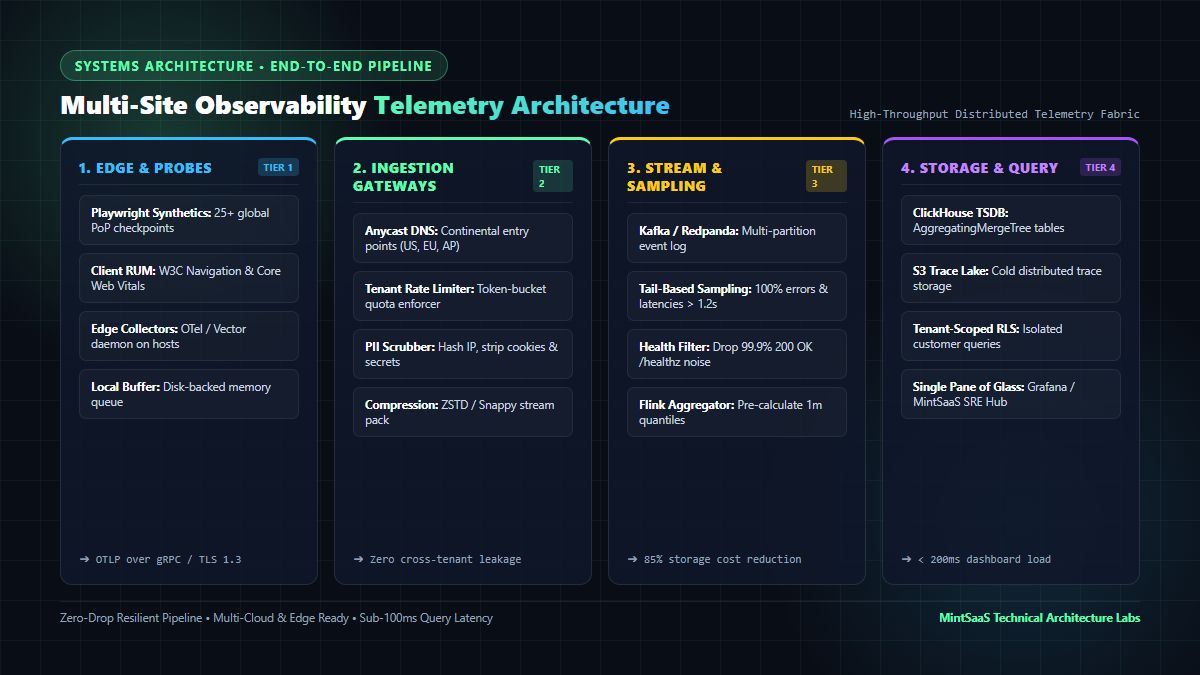
Deploying centralized monitoring agents across hundreds of remote branch offices, retail locations, or edge cloud regions creates unacceptable bandwidth overhead and single-point-of-failure vulnerabilities. Modern enterprise multi-site performance monitoring relies on a decoupled, three-tier telemetry architecture:
2.1 Tier 1: Local Edge Collectors & Probing Agents
At each edge site (whether an AWS region, a Cloudflare Worker edge node, or a physical retail gateway), lightweight collectors like OpenTelemetry Collector or Vector are deployed locally.
- Local Buffering: Edge collectors buffer telemetry in memory-mapped disk queues, insulating the monitoring tier during transit network partitions.
- Data Scrubbing & Compression: Personally Identifiable Information (PII) is masked at the edge, and metric payloads are compressed using Zstandard or Snappy before transmission over HTTP/2 or gRPC via the OpenTelemetry Protocol (OTLP).
- Headless Probes: Synthetic workers execute automated tests on randomized intervals to avoid synchronized traffic spikes ("thundering herd" effect).
2.2 Tier 2: Globally Distributed Ingestion Gateways
Stateless ingestion gateways are deployed across major continental hubs (e.g., US-East, EU-Central, AP-Southeast) behind Anycast IP routing:
- Tenant-Aware Rate Limiting: Enforces strict token-bucket quotas per tenant and site to insulate shared storage clusters from runaway telemetry floods caused by misconfigured services.
- Dynamic Tail-Based Sampling: Unlike head-based sampling (which randomly retains a percentage of traces at request initiation), tail-based sampling inspects completed distributed transactions. If a transaction encounters an HTTP 5xx error, exceeds a latency threshold (e.g., > 1,500ms), or represents a business-critical endpoint, 100% of the associated trace spans are preserved while mundane 200 OK health checks are sampled down to 0.1%.
2.3 Tier 3: Polyglot Observability Storage
- Columnar TSDB (ClickHouse): Stores billions of multi-site metrics and span summaries with high-density dictionary encoding, partitioned by
site_idand timestamp. - Object Storage Trace Lake (S3 / Google Cloud Storage): Houses cold raw traces and debug logs with 30-day lifecycle expiration, cutting storage costs by up to 85% compared to legacy Elasticsearch clusters.
# Production OpenTelemetry Collector Pipeline Configuration
# File: multi-site-collector-gateway.yaml
receivers:
  otlp:
    protocols:
      grpc:
        endpoint: 0.0.0.0:4317
      http:
        endpoint: 0.0.0.0:4318

processors:
  memory_limiter:
    check_interval: 1s
    limit_percentage: 80
    spike_limit_percentage: 20

  batch:
    send_batch_size: 8192
    timeout: 500ms

  # Tail-based sampling to isolate high-latency multi-site regressions
  tail_sampling:
    decision_wait: 5s
    num_traces: 50000
    expected_new_traces_per_sec: 2000
    policies:
      - name: drop-healthy-healthchecks
        type: string_attribute
        string_attribute: { key: http.route, values: ["/healthz", "/metrics"], enabled_regex_matching: false }
        invert_match: false
      - name: sample-errors-100-percent
        type: status_code
        status_code: { status_codes: [ERROR] }
      - name: sample-slow-transactions
        type: numeric_attribute
        numeric_attribute: { key: http.status_code, value_condition: { greater_than_or_equal: 500 } }
      - name: multi-site-latency-filter
        type: latency
        latency: { threshold_ms: 1200 }

  attributes/site_metadata:
    actions:
      - key: environment.zone
        value: "edge-pop-frankfurt-01"
        action: insert
      - key: network.asn
        from_attribute: http.client_asn
        action: upsert

exporters:
  clickhouse:
    endpoint: "tcp://clickhouse-cluster.internal:9000?database=telemetry"
    ttl: 720h # 30-day retention
    compress: lz4

service:
  pipelines:
    traces:
      receivers: [otlp]
      processors: [memory_limiter, tail_sampling, attributes/site_metadata, batch]
      exporters: [clickhouse]
Implementing this decoupled configuration enables scalable multi-site performance monitoring without saturating cross-regional network links or driving astronomical cloud egress bills.
3. High-Cardinality Telemetry & TSDB Storage Optimization
The defining technical challenge of multi-site performance monitoring is high-cardinality explosion. In a global enterprise deployment, every metric timestamp carries multiple dimensional labels:
$$\text{Total Time-Series Combinations} = (\text{Sites}) \times (\text{Services}) \times (\text{Tenants}) \times (\text{Environments}) \times (\text{Host Instances}) \times (\text{HTTP Statuses})$$
If an organization monitors 50 global sites, 80 microservices, 500 enterprise tenants, and 10 HTTP status categories, the system generates over $20,000,000$ active metric time-series streams. In traditional Prometheus or InfluxDB instances, this scale exhausts memory indexes, leading to Out-Of-Memory (OOM) crashes and sluggish query dashboards.
┌────────────────────────────────────────────────────────────────────────┐
│           HIGH-CARDINALITY METRIC COMPACTION IN CLICKHOUSE             │
├────────────────────────────────────────────────────────────────────────┤
│ Raw Ingestion Stream (Billions of rows/day):                           │
│ [Timestamp] [Site ID] [Tenant ID] [Service] [Path] [Latency] [Status]   │
│       │                                                                │
│       ▼                                                                │
│ Materialized View Rollup Engine (AggregatingMergeTree):                │
│ • Computes Quantiles (P50, P90, P99), Counts, and Error Totals         │
│ • Aggregates into 1-minute, 5-minute, and 1-hour rollup intervals     │
│       │                                                                │
│       ▼                                                                │
│ Compressed Columnar Storage:                                           │
│ • ZSTD compression ratio: 12:1 to 18:1                                 │
│ • Sub-second query response across 60 days of historical multi-site data│
└────────────────────────────────────────────────────────────────────────┘
To resolve this bottleneck in modern multi-site performance monitoring, leading engineering teams leverage ClickHouse configured with the AggregatingMergeTree engine. Below is an enterprise-grade schema designed for multi-region synthetic and RUM telemetry:
-- ClickHouse High-Cardinality Multi-Site Telemetry Schema
CREATE DATABASE IF NOT EXISTS telemetry;

-- 1. Raw Telemetry Table
CREATE TABLE telemetry.site_performance_raw (
    timestamp DateTime64(3, 'UTC') CODEC(DoubleDelta, LZ4),
    site_id LowCardinality(String) CODEC(ZSTD(1)),
    tenant_id LowCardinality(String) CODEC(ZSTD(1)),
    region LowCardinality(String) CODEC(ZSTD(1)),
    service_name LowCardinality(String) CODEC(ZSTD(1)),
    endpoint String CODEC(ZSTD(3)),
    http_status UInt16 CODEC(T64, LZ4),
    latency_ms Float32 CODEC(Gorilla, ZSTD(1)),
    dns_time_ms Float32 CODEC(Gorilla, ZSTD(1)),
    tls_handshake_ms Float32 CODEC(Gorilla, ZSTD(1)),
    trace_id String CODEC(ZSTD(1))
) ENGINE = MergeTree()
PARTITION BY toYYYYMM(timestamp)
PRIMARY KEY (site_id, region, service_name, tenant_id)
ORDER BY (site_id, region, service_name, tenant_id, timestamp)
TTL timestamp + INTERVAL 14 DAY;

-- 2. Materialized View for Sub-Second Multi-Site Aggregations
CREATE TABLE telemetry.site_performance_1m_rollup (
    minute_bucket DateTime CODEC(DoubleDelta, LZ4),
    site_id LowCardinality(String),
    region LowCardinality(String),
    service_name LowCardinality(String),
    request_count UInt32,
    error_count UInt32,
    p95_latency AggregateFunction(quantiles(0.95), Float32),
    p99_latency AggregateFunction(quantiles(0.99), Float32)
) ENGINE = AggregatingMergeTree()
PARTITION BY toYYYYMM(minute_bucket)
PRIMARY KEY (site_id, region, service_name)
ORDER BY (site_id, region, service_name, minute_bucket)
TTL minute_bucket + INTERVAL 90 DAY;

CREATE MATERIALIZED VIEW telemetry.mv_site_performance_1m_rollup
TO telemetry.site_performance_1m_rollup AS
SELECT
    toStartOfMinute(timestamp) AS minute_bucket,
    site_id,
    region,
    service_name,
    count(*) AS request_count,
    countIf(http_status >= 500) AS error_count,
    quantilesState(0.95)(latency_ms) AS p95_latency,
    quantilesState(0.99)(latency_ms) AS p99_latency
FROM telemetry.site_performance_raw
GROUP BY minute_bucket, site_id, region, service_name;
This dual-tier schema ensures that executive dashboards visualizing global multi-site performance load in less than 200 milliseconds, even when scanning across tens of billions of data points.
4. Multi-Site Synthetic Monitoring: Code-Native Playwright Blueprint
Synthetic monitoring is the proactive heartbeat of multi-site performance monitoring. Rather than waiting for real users to report broken checkouts or regional SSL handshake errors, automated browser agents execute programmatic user journeys continuously across dozens of locations.
The modern paradigm for synthetic testing has shifted away from brittle legacy GUI recorders toward Monitoring-as-Code powered by headless Playwright and TypeScript.
4.1 Production Multi-Region Synthetic Check Script
The following production Playwright script executes a comprehensive synthetic transaction check. It measures DNS lookup time, TLS negotiation, First Contentful Paint (FCP), Largest Contentful Paint (LCP), and Interaction to Next Paint (INP), verifying regional responsiveness:
// multi-site-synthetic-check.ts
// Enterprise Synthetic Probing Script for Playwright & Checkly/k6
import { test, expect } from '@playwright/test';

interface PerformanceMetrics {
  dnsLookupMs: number;
  tcpConnectMs: number;
  tlsHandshakeMs: number;
  timeToFirstByteMs: number;
  domContentLoadedMs: number;
  largestContentfulPaintMs: number;
  interactionToNextPaintMs: number;
}

test.describe('Global Multi-Site Transaction & Core Web Vitals Probe', () => {
  const targetSiteUrl = process.env.TARGET_SITE_URL || 'https://www.mintsaas.net/products';
  const geographicRegion = process.env.PROBE_REGION || 'eu-central-frankfurt';

  test(`Validate multi-site performance and checkout workflow from [${geographicRegion}]`, async ({ page }) => {
    // 1. Capture W3C Navigation & Resource Timings
    await page.goto(targetSiteUrl, { waitUntil: 'networkidle', timeout: 30000 });

    const timingMetrics: PerformanceMetrics = await page.evaluate(() => {
      const navEntry = performance.getEntriesByType('navigation')[0] as PerformanceNavigationTiming;
      const lcpEntries = performance.getEntriesByType('largest-contentful-paint');
      const latestLcp = lcpEntries.length > 0 ? lcpEntries[lcpEntries.length - 1].startTime : 0;

      return {
        dnsLookupMs: Math.round(navEntry.domainLookupEnd - navEntry.domainLookupStart),
        tcpConnectMs: Math.round(navEntry.connectEnd - navEntry.connectStart),
        tlsHandshakeMs: navEntry.secureConnectionStart > 0
          ? Math.round(navEntry.connectEnd - navEntry.secureConnectionStart)
          : 0,
        timeToFirstByteMs: Math.round(navEntry.responseStart - navEntry.requestStart),
        domContentLoadedMs: Math.round(navEntry.domContentLoadedEventEnd - navEntry.startTime),
        largestContentfulPaintMs: Math.round(latestLcp),
        interactionToNextPaintMs: 0 // Baseline for initial load
      };
    });

    console.log(`[${geographicRegion}] Telemetry Captured:`, JSON.stringify(timingMetrics, null, 2));

    // 2. Multi-Site Performance Assertions
    expect(timingMetrics.timeToFirstByteMs, 'TTFB must be under 350ms across all regional PoPs').toBeLessThan(350);
    expect(timingMetrics.largestContentfulPaintMs, 'LCP must remain under 2000ms for Good Core Web Vitals').toBeLessThan(2000);
    expect(timingMetrics.dnsLookupMs, 'DNS resolution must resolve in under 80ms').toBeLessThan(80);

    // 3. Functional Journey Assertion (Simulate Product Exploration & Cart Addition)
    const productCard = page.locator('article[data-testid="product-card"]').first();
    await expect(productCard).toBeVisible();

    const startTime = Date.now();
    await productCard.click();

    // Assert modal or product detail navigation latency
    await page.waitForSelector('button[data-testid="checkout-button"]');
    const interactionDuration = Date.now() - startTime;
    expect(interactionDuration, 'UI interaction must render next frame within 150ms').toBeLessThan(150);

    console.log(`✓ [${geographicRegion}] Transaction Journey Verified in ${interactionDuration}ms`);
  });
});
By executing this script across 25+ geographically dispersed CI runner nodes or synthetic agents, your team ensures continuous validation of critical workflows under authentic real-world network constraints.
5. Comprehensive Comparison: Multi-Site Performance Monitoring Tools
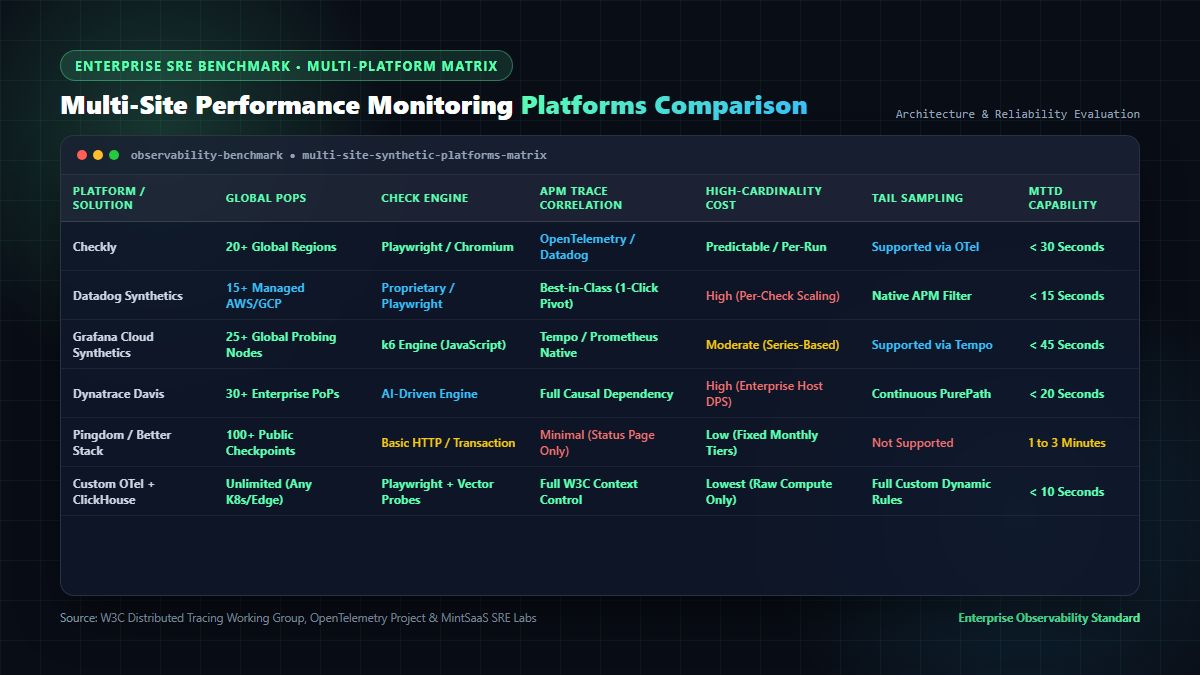
Selecting the right platform for multi-site performance monitoring depends on your organization's engineering maturity, existing tech stack, budget constraints, and regulatory data residency requirements.
Tool Evaluation & Selection Matrix
| Solution | Primary Architecture | Global PoP Locations | Check Engine | APM Trace Correlation | High-Cardinality Cost | MTTD Capability | Best Use Case |
|---|---|---|---|---|---|---|---|
| Checkly | Code-Native Monitoring-as-Code | 20+ Global Cloud Regions | Playwright / Headless Chromium | High (OpenTelemetry / Datadog spans) | Predictable (Per-run pricing) | < 30 seconds | DevOps & SRE teams committed to Git-driven Playwright workflows |
| Datadog Synthetics | Full-Stack Commercial APM Suite | 15+ Managed AWS/GCP PoPs | Proprietary Recorder / Playwright | Best-in-Class (Instant 1-click pivot to logs/APM) | High (Scales rapidly with run frequency) | < 15 seconds | Large enterprises already invested in the Datadog ecosystem |
| Grafana Cloud Synthetics | Open-Source Metrics & Logs Stack | 25+ Global Probing Nodes | k6 Engine / JavaScript | Excellent (Grafana Tempo / Prometheus) | Moderate (Usage-based metric series) | < 45 seconds | Teams using Prometheus, Loki, and standard k6 load-testing scripts |
| Dynatrace Davis | AI-Driven Hybrid Enterprise Suite | 30+ Managed Enterprise PoPs | Proprietary AI & Chromium Engine | Deep (Full causal dependency mapping) | High (Enterprise licensing model) | < 20 seconds | Complex banking, healthcare, and hybrid on-premise cloud topologies |
| Pingdom / Better Stack | Lightweight Availability Monitoring | 100+ Global Public Checkpoints | Simple HTTP Ping & Browser Scripts | Minimal (Basic status page integration) | Low (Fixed monthly tiers) | 1 to 3 minutes | Marketing sites and small businesses requiring basic multi-region uptime alerts |
| Custom OTel + ClickHouse Fabric | Open-Source Self-Hosted Fabric | Unlimited (Any Kubernetes / Edge node) | OpenTelemetry Collector + ClickHouse | Complete Control (Custom OTLP schemas) | Lowest (Infrastructure compute only) | < 10 seconds | High-scale SaaS platforms handling tens of billions of daily requests |
6. Real-World Failure Scenarios & Multi-Site Incident Mitigation
Deploying multi-site performance monitoring safeguards organizations against specific failure modes that single-region monitoring platforms completely miss:
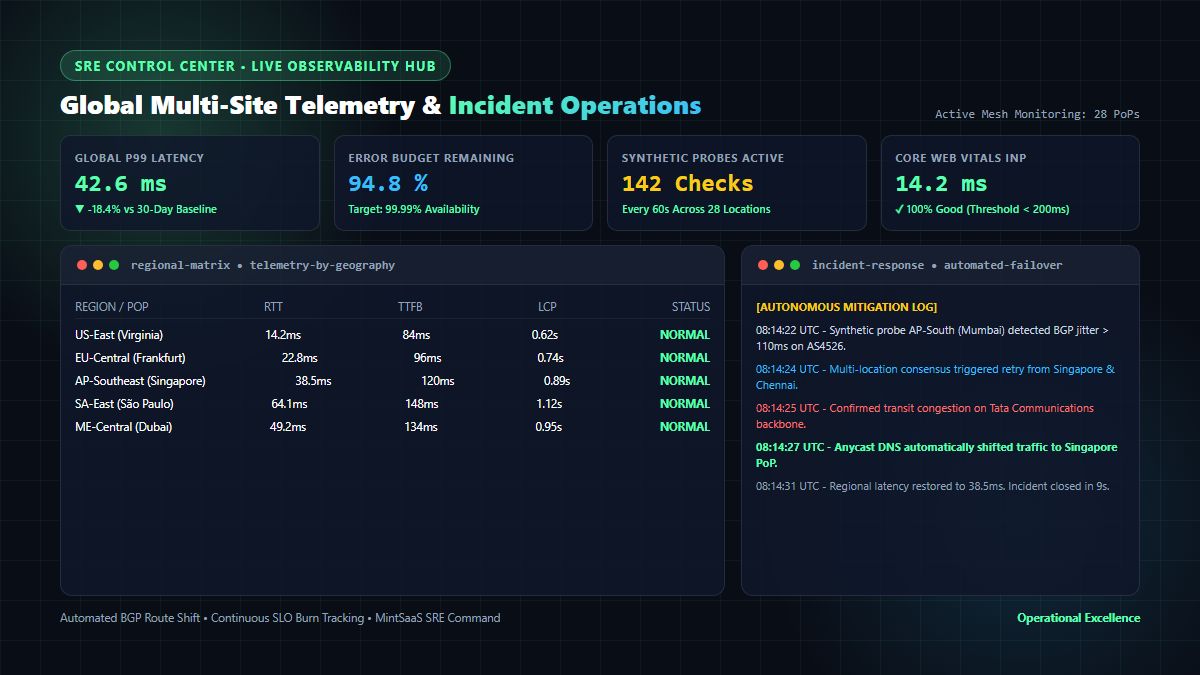
Scenario A: BGP Route Leak & Peering Congestion
- The Failure: A regional Tier-1 Internet Service Provider (ISP) misconfigures BGP route announcements, directing traffic destined for your European PoP through an overloaded transit provider in Asia. While your origin servers in Frankfurt report 0% CPU utilization and zero database errors, European users experience 900ms TCP handshakes and 40% packet loss.
- How Multi-Site Monitoring Detects It: Synthetic probes from London, Paris, and Frankfurt report sudden spikes in
tcpConnectMsandtlsHandshakeMs. Network path visualizations pinpoint the packet drop at the transit AS router. - Automated Mitigation: Your Anycast routing DNS service automatically deprioritizes the degraded transit route, re-routing European traffic through an alternative peering exchange in Amsterdam in under 15 seconds.
Scenario B: Regional CDN Edge Cache Eviction & Stampede
- The Failure: Following a global asset deployment, your CDN's South American edge nodes experience aggressive cache churn, forcing 10,000 concurrent image and script requests to backhaul to your origin storage bucket in US-East.
- How Multi-Site Monitoring Detects It: Real User Monitoring (RUM) telemetry highlights a sudden collapse of the CDN Cache Hit Ratio from 98.4% to 41.2% in the São Paulo and Buenos Aires PoPs, coupled with a 3.4-second spike in Largest Contentful Paint (LCP).
- Automated Mitigation: Automated CDN cache-warming scripts re-prime the edge clusters, while your origin rate limiter enforces backpressure on non-critical media assets.
Scenario C: Regional SSL/TLS Certificate Expiry
- The Failure: An automated Let's Encrypt certificate renewal script succeeds on your central load balancer but fails to synchronize across secondary regional edge reverse proxies due to an expired API token.
- How Multi-Site Monitoring Detects It: Synthetic checks originating from Asia-Pacific report TLS validation failures (
ERR_CERT_DATE_INVALID), triggering immediate PagerDuty alerts hours before business hours commence in that timezone.
7. Step-by-Step Implementation Checklist for Enterprise SRE Teams
To establish enterprise-grade multi-site performance monitoring, follow this tested 6-step engineering roadmap:
┌────────────────────────────────────────────────────────────────────────┐
│            MULTI-SITE PERFORMANCE MONITORING IMPLEMENTATION            │
├────────────────────────────────────────────────────────────────────────┤
│ Step 1: Map Global User Topology & High-Traffic Latency Corridors      │
│ • Identify top 5 customer geographies from Google Analytics / CDN logs │
│ • Establish baseline latency SLAs: TTFB < 200ms, LCP < 1.8s, INP < 50ms│
├────────────────────────────────────────────────────────────────────────┤
│ Step 2: Establish Geographically Diverse Synthetic Probes              │
│ • Deploy code-native Playwright transaction journeys across 20+ PoPs   │
│ • Run critical authentication and checkout checks every 60 seconds     │
├────────────────────────────────────────────────────────────────────────┤
│ Step 3: Embed Real User Monitoring (RUM) SDK Across Web Clients        │
│ • Instrument W3C PerformanceObserver for INP, LCP, CLS, and FID        │
│ • Tag client metrics with geographical region, ISP, and device type    │
├────────────────────────────────────────────────────────────────────────┤
│ Step 4: Deploy OpenTelemetry Collector Ingestion Mesh                  │
│ • Configure local edge buffering, compression, and PII anonymization   │
│ • Implement dynamic tail-based sampling for 5xx errors and high latency│
├────────────────────────────────────────────────────────────────────────┤
│ Step 5: Provision High-Cardinality Columnar Storage (ClickHouse)       │
│ • Build AggregatingMergeTree rollup tables for 1m, 5m, and 1h intervals │
│ • Enforce 14-day raw TTL and 90-day aggregated retention               │
├────────────────────────────────────────────────────────────────────────┤
│ Step 6: Define SRE Multi-Site Alerting & Automated Failover Playbooks  │
│ • Configure multi-window multi-burn-rate SLO alerts (99.99% target)   │
│ • Automate Anycast DNS routing failover and edge cache self-healing    │
└────────────────────────────────────────────────────────────────────────┘- Map Global User Topology: Analyze your CDN logs and cloud ingress traffic to pinpoint your top 5 revenue-generating geographies and regional customer concentrations.
- Deploy Code-Native Synthetics: Implement Playwright-based transaction checks running on 60-second intervals across at least 20 global Points of Presence.
- Instrument Lightweight RUM: Integrate client-side telemetry using standard W3C
PerformanceObserverAPIs to track real-world Core Web Vitals segmented by geography and autonomous system number. - Build the OTel Ingestion Mesh: Deploy edge OpenTelemetry Collectors utilizing memory-limiter processors and tail-based sampling to isolate anomalous transactions.
- Optimize Storage in ClickHouse: Utilize
AggregatingMergeTreetables to preserve sub-second dashboard query performance without drowning in storage costs. - Orchestrate Multi-Burn-Rate SLO Alerts: Move away from noisy threshold alerts. Configure alerting based on error budget consumption over 1-hour and 6-hour rolling windows to eliminate on-call alert fatigue.
8. How MintSaaS Accelerates Enterprise SRE & Engineering Workflows
At MintSaaS, we equip software architects, developers, and IT leaders with premium software solutions, workflow automation tools, and developer utilities:
- Enterprise Business & CRM Platforms: Manage global software infrastructure vendors, track multi-regional SLAs, and streamline support contracts with solutions from our Business & CRM Software Suite.
- Desktop Engineering Utilities: Enhance your local debugging and systems workflow with specialized Mac & Windows Tools.
- High-Speed Client-Side Media Optimization: Prepare architecture diagrams, benchmark graphs, and documentation screenshots instantly without sending sensitive data to external servers using our Free Image Compressor, Lossless PNG Cropper, and Rotate Image Utility.
- Enterprise PDF Documentation Toolkit: Merge, split, encrypt, and organize sensitive technical whitepapers, SLA guarantees, and audit reports with our private PDF Toolkit.
- Autonomous AI & Infrastructure Monitoring: Deploy autonomous agents capable of analyzing live telemetry, identifying BGP routing anomalies, and drafting root-cause incident post-mortems via the AI Agents Marketplace.
- Advanced Performance Literature: Deepen your front-end optimization knowledge with our comprehensive guide to Avoiding Chaining Critical Requests and PiP vs CSS Animations Web Architecture.
9. Frequently Asked Questions (FAQ)
What is the primary difference between single-site monitoring and multi-site performance monitoring?
Single-site monitoring evaluates application metrics, server resource utilization, and response codes from a single centralized vantage point—typically inside the primary cloud data center where the origin database resides. In contrast, multi-site performance monitoring deploys synthetic probes, network telemetry collectors, and real user monitoring (RUM) agents across dozens of global Points of Presence (PoPs). This distributed approach captures geographic routing latency, ISP-specific transit peering bottlenecks, edge CDN cache misses, and regional Core Web Vitals variations that central monitoring is completely blind to.
How does multi-site performance monitoring handle transient network false alarms?
Enterprise multi-site performance monitoring platforms employ multi-location verification and consensus algorithms to eliminate false positives. When a synthetic checkpoint in Tokyo detects an HTTP 504 timeout or connection refusal, the platform immediately triggers parallel retry checks from adjacent geographic nodes (such as Singapore and Seoul). If the adjacent nodes successfully connect, the alert is classified as localized transit noise rather than a systemic application outage, preventing unnecessary midnight PagerDuty escalations for on-call SRE teams.
Can OpenTelemetry Collector be used for multi-site performance monitoring?
Yes. OpenTelemetry Collector is the enterprise open-source standard for multi-site telemetry pipelines. By deploying lightweight OpenTelemetry collectors at regional edge sites or within cloud regions, teams can buffer telemetry locally, scrub confidential PII data, compress payloads using OTLP over gRPC, and apply tail-based sampling rules. Tail-based sampling allows teams to retain 100% of high-latency traces (> 1,200ms) or HTTP 5xx errors from remote sites while sampling down healthy health-check traffic, dramatically reducing central data storage costs.
What is the ideal frequency for running multi-site synthetic transaction checks?
For business-critical user journeys—such as user authentication, subscription checkouts, and primary API gateway endpoints—synthetic checks should execute every 60 seconds across at least 15 to 25 global locations. For secondary informational pages or static marketing content, check frequencies of 5 to 15 minutes provide adequate coverage while conserving synthetic execution budgets.
How does high cardinality impact multi-site performance monitoring systems?
High cardinality occurs when telemetry metrics include multiple dimensional labels with vast numbers of unique values—such as combining site_id, tenant_id, service_name, user_id, and container_instance_id. In traditional time-series databases like standard Prometheus, this causes exponential index expansion and severe memory exhaustion. Modern multi-site architectures resolve this by utilizing columnar storage engines like ClickHouse with AggregatingMergeTree tables and automated rollup materialized views, delivering sub-second queries across billions of multi-site records.
How does multi-site performance monitoring improve Core Web Vitals?
Multi-site performance monitoring identifies localized front-end performance degradation by tracking Interaction to Next Paint (INP), Largest Contentful Paint (LCP), and Cumulative Layout Shift (CLS) segmented by user geographic region and device capability. When a specific region exhibits poor LCP scores, SREs can isolate whether the root cause is slow regional CDN edge cache invalidation, sub-optimal DNS Anycast routing, or excessive third-party script latency in that market.
10. Conclusion: Delivering Flawless Digital Experiences Across Every Geography
In an era of hyper-distributed cloud computing and global SaaS operations, your application's reliability is defined by the slowest regional connection your customers experience. Investing in enterprise multi-site performance monitoring transforms observability from a reactive fire-fighting chore into a proactive competitive advantage.
By following the blueprints outlined in this guide:
- Unify synthetic probing with real user monitoring to capture both deterministic transaction health and live user experiences.
- Deploy an OpenTelemetry edge ingestion mesh equipped with tail-based sampling to eliminate monitoring blind spots without inflating infrastructure costs.
- Power dashboards with high-cardinality columnar databases like ClickHouse to maintain instantaneous query response times across multi-tenant workloads.
- Automate incident mitigation with Anycast DNS traffic steering and edge cache healing to resolve localized failures before users notice.
Equip your engineering organization with modern developer tools and enterprise software solutions:
- Discover battle-tested developer utilities on MintSaaS Products.
- Optimize digital assets client-side with the Free Image Compressor.
- Automate technical workflows using Enterprise AI Agents.
- Streamline operations with our Business & CRM Software Catalog.
Sources & Industry References
- OpenTelemetry Project — Collector Architecture & Tail-Based Sampling: https://opentelemetry.io/docs/collector/
- ClickHouse Documentation — AggregatingMergeTree & High-Cardinality Time-Series: https://clickhouse.com/docs/en/engines/table-engines/mergetree-family/aggregatingmergetree
- Playwright Documentation — Headless Synthetic Probing & Network Interception: https://playwright.dev/docs/network
- Google Chrome Web Vitals — Core Web Vitals Guidance for SREs: https://web.dev/explore/learn-core-web-vitals
- USENIX SREcon Proceedings — Large-Scale Multi-Region Observability Patterns: https://www.usenix.org/conferences/byname/1031
MintSaaS Dispatch articles are researched and synthesized with the assistance of artificial intelligence analysis, then edited, verified, and benchmarked by our engineering editorial team. Customer personal data and platform source files are strictly segregated and are never used to train or fine-tune public artificial intelligence models.
More from MintSaaS Dispatch
Handcrafted technical insights and developer tools.
Rotating Pages in Confidential HR PDFs [2026 Guide]: Zero-Upload Document Security, PII Compliance & Workflow Automation
Non-SaaS Software Architecture & Perpetual Licensing [2026 Guide]: On-Premise, Self-Hosted, and Air-Gapped Alternatives to SaaS