How to Monitor Third-Party Script Performance on Web Pages? [2026 SRE & Core Web Vitals Guide]
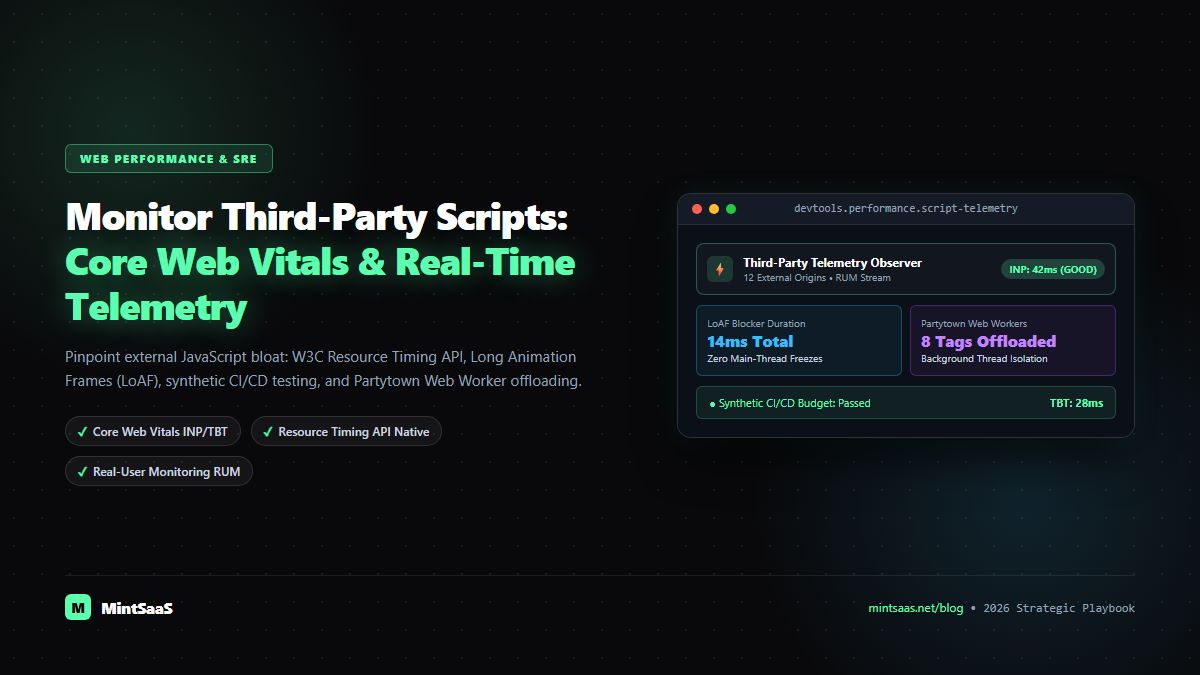
Complete 2026 engineering guide to monitoring third-party script performance: W3C Resource Timing API, Long Animation Frames (LoAF), synthetic CI/CD testing, and Partytown Web Worker isolation.
How to Monitor Third-Party Script Performance on Web Pages? [2026 SRE & Core Web Vitals Guide]
Executive Summary & AEO Direct Answer: How do you monitor third-party script performance on web pages in 2026? To monitor third-party script performance effectively, engineering and SRE teams must implement a hybrid observability architecture combining Synthetic Monitoring (via Chrome DevTools Protocol and automated Lighthouse/WebPageTest CI/CD audits) with Real User Monitoring (RUM) using modern browser performance APIs: the W3C Resource Timing API, the Long Animation Frames API (LoAF), and the PerformanceObserver interface. By programmatically tracking DNS resolution, TLS handshakes, transfer size, and main-thread execution time attributed to external domains (such as Google Tag Manager, Meta Pixel, analytics beacons, and customer chat widgets), teams can detect script regressions before they degrade Core Web Vitals (specifically Interaction to Next Paint [INP] and Total Blocking Time [TBT]).
Third-party scripts represent the single greatest source of performance volatility, security exposure, and user experience degradation across modern web applications. Marketing tags, analytics trackers, customer support live-chats, A/B testing SDKs, and payment gateways are frequently injected into production web pages without strict engineering oversight.
While internal application code undergoes rigorous code reviews, automated unit testing, and static analysis, third-party JavaScript files are hosted on external Content Delivery Networks (CDNs) and updated dynamically outside your deployment lifecycle. When an external vendor pushes an unoptimized bundle or experiences an edge latency outage, your users suffer bloated Time to First Byte (TTFB), prolonged main-thread blocking, and unresponsive user interactions.
In Google’s current search ranking algorithms, page performance—measured through Core Web Vitals—is an established technical ranking signal. Specifically, the replacement of First Input Delay (FID) with Interaction to Next Paint (INP) has severely penalized web pages where heavy third-party tags monopolize the browser’s main execution thread.
In this definitive 2026 engineering guide, we dissect the exact methodologies, native browser APIs, automated synthetics, and architectural containment strategies required to monitor, isolate, and neutralize third-party script performance drag across enterprise web applications.
1. The Anatomy of Third-Party Script Bloat
To monitor external scripts effectively, one must understand how they consume browser resources. A third-party script harms web performance across four distinct vectors:
┌────────────────────────────────────────────────────────────────────────┐
│             FOUR VECTORS OF THIRD-PARTY PERFORMANCE DRAG               │
├───────────────────────────────────┬────────────────────────────────────┤
│ 1. Network & Handshake Overhead   │ Distinct DNS lookup, TCP connect,  │
│                                   │ and TLS 1.3 handshake per domain.  │
├───────────────────────────────────┼────────────────────────────────────┤
│ 2. Uncompressed Transfer Payload  │ Massive unminified JavaScript      │
│                                   │ consuming mobile bandwidth.        │
├───────────────────────────────────┼────────────────────────────────────┤
│ 3. Main-Thread CPU Monopolization │ Long execution tasks (>50ms)       │
│                                   │ blocking UI interactions (INP/TBT).│
├───────────────────────────────────┼────────────────────────────────────┤
│ 4. Single-Point-of-Failure (SPOF) │ Synchronous or blocking tags that  │
│                                   │ stall document rendering entirely. │
└───────────────────────────────────┴────────────────────────────────────┘
When a browser loads an external tag (e.g., https://analytics.example.com/tracker.js), it cannot leverage the existing HTTP/3 or HTTP/2 multiplexed connection to your primary origin server. It must resolve the new hostname, establish a new socket, and negotiate encryption keys.
Once downloaded, the browser’s JavaScript engine (Google V8, Apple JavaScriptCore, or Mozilla SpiderMonkey) must parse, compile, and execute the bundle on the browser's single main thread. If this execution exceeds 50 milliseconds, it is categorized as a Long Task, freezing UI animations and delaying user inputs.
To master how third-party script optimization fits into broader WordPress and enterprise CMS stacks, explore our in-depth architectural guide on WordPress third-party script optimization, our tutorial on avoiding critical request chains, and our benchmarks on how to measure website performance with modern tools and metrics.
2. In-Browser Telemetry: Real User Monitoring (RUM) with Native APIs
The most accurate measure of third-party script performance comes directly from real end-user sessions. Modern web browsers provide powerful native telemetry interfaces through the W3C Performance Timeline Specification.
A. Tracking Network Latency via Resource Timing API
The Resource Timing API captures granular network timings for every asset loaded on your page:
// Native In-Browser PerformanceObserver for Third-Party Assets
const thirdPartyTracker = new PerformanceObserver((list) => {
  const entries = list.getEntries();
  const currentOrigin = window.location.origin;

  entries.forEach((entry) => {
    const assetUrl = new URL(entry.name);

    // Filter for external third-party origins
    if (assetUrl.origin !== currentOrigin && entry.initiatorType === 'script') {
      const dnsTime = entry.domainLookupEnd - entry.domainLookupStart;
      const tcpTime = entry.connectEnd - entry.connectStart;
      const ttfb = entry.responseStart - entry.requestStart;
      const downloadTime = entry.responseEnd - entry.responseStart;
      const totalDuration = entry.duration;

      console.warn(`[Third-Party Script Alert] Origin: ${assetUrl.hostname}`);
      console.table({
        'Host': assetUrl.hostname,
        'DNS (ms)': dnsTime.toFixed(1),
        'TCP/TLS (ms)': tcpTime.toFixed(1),
        'TTFB (ms)': ttfb.toFixed(1),
        'Download (ms)': downloadTime.toFixed(1),
        'Total Duration (ms)': totalDuration.toFixed(1),
        'Transfer Size (KB)': (entry.transferSize / 1024).toFixed(1)
      });
    }
  });
});

thirdPartyTracker.observe({ type: 'resource', buffered: true });
B. Pinpointing UI Lag with Long Animation Frames (LoAF) API
While Resource Timing tracks network transfer, the Long Animation Frames API (LoAF) (which supersedes the legacy Long Tasks API in modern Chromium engines) pinpoints exactly which external script hijacked the CPU during a user click:
// Capture Long Animation Frames attributed to Third-Party Scripts
const loafObserver = new PerformanceObserver((list) => {
  list.getEntries().forEach((frame) => {
    if (frame.duration > 50) { // Execution exceeded 50ms frame budget
      frame.scripts.forEach((script) => {
        const sourceUrl = script.sourceURL;
        if (sourceUrl && !sourceUrl.includes(window.location.hostname)) {
          console.error(`[LoAF Blocker] Third-Party Script Caused Main-Thread Delay!`);
          console.log(`Script URL: ${sourceUrl}`);
          console.log(`Invoker: ${script.invokerType} | Duration: ${script.duration.toFixed(2)}ms`);
          console.log(`Compilation Time: ${script.executionStart - script.startTime}ms`);
        }
      });
    }
  });
});

loafObserver.observe({ type: 'long-animation-frame', buffered: true });
By streaming these telemetry beacons to your internal logging endpoints (or platforms like Cloudflare Workers or Supabase), SRE teams gain real-time visibility into which third-party marketing tags are degrading user conversions. For teams debugging client-side scripts, see our guide on how to debug JavaScript using modern tools and techniques.
3. Automated Synthetic Monitoring in CI/CD Pipelines
Real User Monitoring captures what real visitors experience, but Synthetic Monitoring enables engineering teams to catch regressions before third-party changes reach production.
┌────────────────────────────────────────────────────────────────────────┐
│             SYNTHETIC MONITORING IN ENTERPRISE CI/CD PIPELINES         │
├────────────────────────────────────────────────────────────────────────┤
│ 1. Git Push / Deployment Trigger                                       │
│ 2. Headless Chrome Container initializes in test environment           │
│ 3. Automated WebPageTest API / Lighthouse CLI run against page         │
│ 4. Script Isolation Test: Run page WITH tags vs WITHOUT tags           │
│ 5. Calculate "Third-Party Performance Tax" (Delta TBT & LCP)           │
│ 6. If Delta TBT > 150ms: Hard Fail PR & Alert Tag Governance Board     │
└────────────────────────────────────────────────────────────────────────┘
Measuring the "Third-Party Performance Tax"
The most effective synthetic technique is A/B URL Blocking:
- Run a baseline audit of your production URL using WebPageTest or Chrome DevTools.
- Run a secondary audit while blocking external domains using Chrome’s network interception flags:
   # Block third party ad & tracking domains during headless audit
lighthouse https://www.mintsaas.net --chrome-flags="--block-new-web-contents --host-rules='MAP *.google-analytics.com 127.0.0.1', 'MAP *.facebook.net 127.0.0.1'"- Calculate the difference:
$$\text{Third-Party Tax} = \text{TBT}_{\text{Full}} - \text{TBT}_{\text{Blocked}}$$
If third-party scripts add more than 200ms of Total Blocking Time, your organization has a critical tag governance deficit.
To manage and deploy testing fleets efficiently across macOS and Windows CI/CD pipelines, consult our architectural deep dive on autonomous endpoint management for mixed fleets and our SRE framework for enterprise multi-site performance monitoring.
4. Architectural Comparison: Third-Party Script Monitoring Strategies
To design an enterprise observability strategy, compare how different monitoring layers function across the development and operational lifecycle:
| Monitoring Layer | Implementation Mechanism | Metric Focus | Primary Benefit | Trade-off / Limitation |
|---|---|---|---|---|
| Real User Monitoring (RUM) | Native PerformanceObserver (Resource Timing + LoAF) | Real-world INP, LCP, Network Transfer | Reflects authentic user device and network diversity | Adds small client-side telemetry overhead (<3KB) |
| Synthetic CI/CD Audits | WebPageTest API / Headless Lighthouse | Total Blocking Time (TBT), Speed Index | Deterministic, reproducible, blocks bad PRs | Cannot replicate unpredictable live CDN outages |
| Content Security Policy (CSP) Telemetry | Content-Security-Policy-Report-Only | Unauthorized domains, injected scripts | Detects unauthorized tag creep and XSS threats | Reports domain presence, not execution duration |
| Tag Manager Auditing | Google Tag Manager Server-Side / Zaraz | Event firing volume, container payload size | Centralized governance of tag lifecycle | Requires server infrastructure to host proxy |
| Edge Proxy Logging | Cloudflare Workers / Fastly VCL inspection | TTFB, cache hit ratio, origin latency | Zero client overhead, deep infrastructure insight | Lacks visibility into client-side main-thread CPU time |
5. Architectural Mitigation: Moving Beyond Monitoring to Containment
Monitoring alone does not improve Core Web Vitals; engineering teams must act on the collected telemetry by implementing architectural isolation.
       ┌────────────────────────────────────────────────────────┐
       │             THIRD-PARTY SCRIPT CONTAINMENT             │
       ├────────────────────────────────────────────────────────┤
       │ [ Tier 1: Critical (Stripe, Auth) ] ──> Direct Origin  │
       │                                                        │
       │ [ Tier 2: Analytics & Telemetry ]   ──> Partytown      │
       │                                         Web Workers    │
       │                                                        │
       │ [ Tier 3: Marketing & Retargeting ] ──> Cloudflare     │
       │                                         Zaraz Proxy    │
└────────────────────────────────────────────────────────┘- Offloading to Web Workers with Partytown: Tools like Partytown move CPU-heavy marketing libraries (like Google Tag Manager, HubSpot, and Meta Pixel) off the browser’s main thread and into a dedicated background Web Worker thread, reducing Total Blocking Time to near-zero.
- Server-Side Tagging (SST): Instead of executing five separate analytics libraries in the client browser, the browser fires a single lightweight JSON payload to your server-side proxy, which distributes events to third-party endpoints server-to-server.
- Facade Loading for Heavy Widgets: For interactive widgets (such as Intercom chat bubbles or YouTube video embeds), load a static lightweight HTML/SVG placeholder image. Only fetch and execute the heavy third-party bundle when the user explicitly clicks or scrolls into view.
For web teams optimizing digital assets, learn how to compress images without quality loss using our guide on Photoshop and browser compression and compare modern media delivery in our best image CDN developer guide.
6. Implementation Checklist: Enterprise Third-Party Governance
Before deploying marketing or tracking scripts to production, require marketing and engineering stakeholders to complete this 6-point governance checklist:
┌────────────────────────────────────────────────────────────────────────┐
│             THIRD-PARTY SCRIPT GOVERNANCE CHECKLIST                    │
├───────────────────────────────────┬────────────────────────────────────┤
│ 1. Asynchronous Loading           │ Tag MUST use 'async' or 'defer'    │
│                                   │ attributes. Synchronous blocked.   │
├───────────────────────────────────┼────────────────────────────────────┤
│ 2. Resource Hint Optimization     │ Preconnect to external origin only │
│                                   │ for critical above-the-fold assets.│
├───────────────────────────────────┼────────────────────────────────────┤
│ 3. Performance Budget Threshold   │ Script transfer size < 50KB gzip;  │
│                                   │ main-thread execution < 45ms.      │
├───────────────────────────────────┼────────────────────────────────────┤
│ 4. Automatic Timeout Fallback     │ Script must abort if network load  │
│                                   │ exceeds 3,000ms.                   │
├───────────────────────────────────┼────────────────────────────────────┤
│ 5. CSP Domain Whitelist           │ Origin must be explicitly declared │
│                                   │ in production Content-Security-Pol.│
├───────────────────────────────────┼────────────────────────────────────┤
│ 6. Annual Vendor Sunset Review    │ Unused tags audited & pruned       │
│                                   │ quarterly from Tag Manager.        │
└───────────────────────────────────┴────────────────────────────────────┘
Review our foundational web engineering best practices in our deep dives on securing web applications against OWASP Top 10 vulnerabilities and enterprise PDF and document security strategies.
7. Frequently Asked Questions (FAQ)
What is third-party script performance monitoring?
Third-party script performance monitoring is the ongoing practice of measuring the network transfer speed, server latency, and browser main-thread execution time caused by external JavaScript libraries (such as analytics, ad pixels, live chats, and A/B testing widgets) loaded onto your website from third-party domains.
How do third-party scripts hurt Google Core Web Vitals?
Third-party scripts hurt Core Web Vitals primarily by monopolizing the browser’s single main thread. Heavy script parsing and compilation create long tasks (>50ms), directly degrading Interaction to Next Paint (INP) and Total Blocking Time (TBT). Additionally, poorly placed synchronous tags block HTML parsing, delaying Largest Contentful Paint (LCP).
What is the difference between RUM and Synthetic script monitoring?
Real User Monitoring (RUM) collects performance data directly from real visitors’ web browsers using native APIs like Resource Timing and LoAF, capturing authentic device and network variations. Synthetic monitoring runs automated browser tests (like Lighthouse or WebPageTest) in controlled environments, providing consistent baselines to catch regressions before deployment.
How does the Long Animation Frames (LoAF) API help identify bad scripts?
The Long Animation Frames (LoAF) API is a modern Chromium browser interface that detects rendering delays exceeding 50 milliseconds. Unlike legacy task observers, LoAF provides granular script attribution, revealing the exact external URL, script character offset, and invoker function that caused UI jank.
Can moving third-party scripts to Web Workers fix INP scores?
Yes. Offloading heavy third-party libraries (such as Google Tag Manager, Facebook Pixel, and marketing tags) to background Web Workers using frameworks like Partytown removes execution overhead from the browser’s main UI thread, directly improving Interaction to Next Paint (INP) and eliminating input lag.
What is a Third-Party Performance Budget?
A Third-Party Performance Budget is a strict technical limit established by engineering teams defining maximum allowable transfer sizes (e.g., <50KB gzip per vendor) and main-thread execution times (e.g., <50ms per tag) for any external software allowed on production web pages.
8. Related MintSaaS Guides & Deep Dives
To expand your technical web performance, monitoring, and engineering stack, explore these curated MintSaaS resources:
- WordPress Third-Party Script Optimization: Partytown, Zaraz & INP Acceleration — Advanced strategies for eliminating render-blocking tags.
- Avoid Chaining Critical Requests: The Comprehensive Lighthouse Guide — Eliminating sequential dependency chains in web browsers.
- How to Measure Website Performance: Tools and Metrics Guide — Core Web Vitals, synthetics, and lab metrics benchmarked.
- How to Debug JavaScript: Modern Tools and Techniques — Profiling CPU usage, memory leaks, and asynchronous call stacks.
- Best Image CDN Developer Architecture Guide: Cloudflare, Fastly, Imgix & Cloudinary — Edge transformation, origin shielding, and AVIF delivery.
- Multi-Site Performance Monitoring: 2026 Enterprise SRE Guide — Distributed synthetics, telemetry, and uptime observability.
- What Does Autonomous Endpoint Management Look Like for a Mixed Fleet? — Apple DDM, Windows Autopilot, and self-healing systems.
- AI Agent Management Software: Enterprise Multi-Agent Governance — Orchestrating autonomous swarms with deterministic guardrails.
9. Strategic Conclusion: Take Control of Your Page Performance
Third-party scripts do not have to hold your Core Web Vitals and search rankings hostage. By deploying native in-browser telemetry (Resource Timing + LoAF), automating synthetic A/B blocking in your CI/CD pipelines, and enforcing strict vendor performance budgets, engineering teams can deliver rich marketing functionality without sacrificing user experience.
Supercharge your development team and digital infrastructure with MintSaaS:
- Optimize web images instantly with our free MintSaaS Image Compressor.
- Accelerate desktop developer velocity with our Mac & Windows Tools Catalog.
- Automate technical operations and workflows with Enterprise AI Agents.
- Boost organizational output with our curated Productivity Software.
- Manage revenue, customers, and operations with Business & CRM Platforms.
Authoritative Sources & Industry References
- W3C Web Performance Working Group — Resource Timing Level 2 Specification: https://www.w3c.org/TR/resource-timing/
- Google Chrome Developers — Optimize Long Animation Frames (LoAF) API: https://developer.chrome.com/docs/web-platform/long-animation-frames
- MDN Web Docs — PerformanceObserver Interface Documentation: https://developer.mozilla.org/en-US/docs/Web/API/PerformanceObserver
- Google Chrome Web Performance — Learn Core Web Vitals & INP Optimization: https://web.dev/explore/learn-core-web-vitals
- WebPageTest Documentation — Advanced Script Blocking & Synthetic Performance Auditing: https://docs.webpagetest.org/
- Partytown Project — Relocating Resource-Intensive Third-Party Scripts to Web Workers: https://partytown.builder.io/
- Cloudflare Zaraz — Server-Side Third-Party Tag Management & Edge Execution: https://developers.cloudflare.com/zaraz/
- National Institute of Standards and Technology (NIST) — Secure Software Development Framework (SSDF): https://csrc.nist.gov/projects/ssdf
MintSaaS Dispatch articles are researched and synthesized with the assistance of artificial intelligence analysis, then edited, verified, and benchmarked by our engineering editorial team. Customer personal data and platform source files are strictly segregated and are never used to train or fine-tune public artificial intelligence models.
More from MintSaaS Dispatch
Handcrafted technical insights and developer tools.
Bulk-Convert Photos [100% Free & Lossless]: Complete 2026 Guide to Batch RAW, JPEG, HEIC & PNG Processing Online
Combine PDF in Next.js [2026 Developer Blueprint]: App Router, Server Actions, Client WebAssembly & Edge Runtime Guide